Consulting

Can Data Science help you?
As part of our everyday activities, Nextbit uses data to solve tangible real-world problems. To achieve this, we turn (Big) data into information using Data Science and Artificial Intelligence. Our experience tells that the number of applications for (Big) data are practically infinite. One way to think about it is to ask yourself, what problem are you trying to solve? Would granular and accurate information help you in solving it? An extremely large number of problems can be addressed by converting (Big) data into information, this by the way, is one of the main reasons why we are so passionate about our field of practice, it is extremely pervasive.
A data rich society
A very important trend in Data Science is that things are beginning to run on data, we’re getting more and more data as a result of this. We live in an increasingly data-rich society. This has a direct impact on “knowledge”, which is now a key differentiator in transforming both society and industries.
Data maturity
The way we use (Big) Data, collected by machinery or transactional system (often referred to as “raw data”), is to transform it into Information (data processed into form usable by humans), then Knowledge, (information that has been internalized & understood), and finally Wisdom (knowing what actions to take given Knowledge), this process is not simple. Below, we summarize and have generalized part of the data maturity process. It is not a linear process or waterfall, rather, it’s a cycle that feeds on itself.
Generalized Data Maturity Process
The data maturity process guides the general design and implementation of, for example, Classification and Predictive Models. The process starts with a problem definition phase, the diagram below is a high level overview.
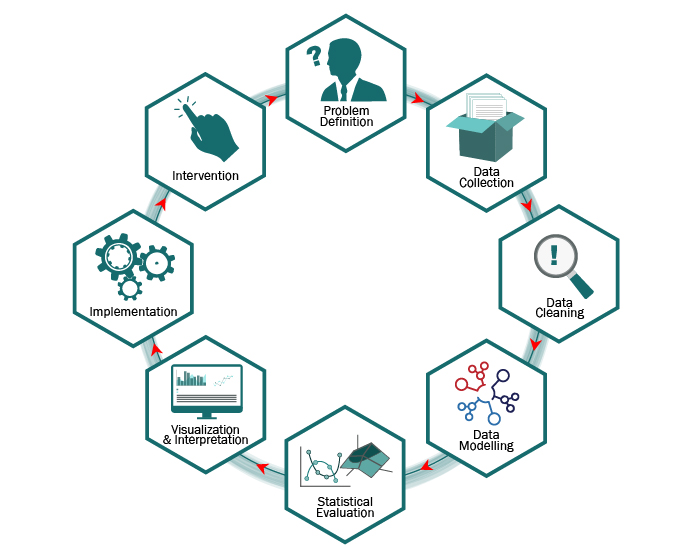
- Problem Definition. Defining objectives, assumptions, limitations and requirements is a crucial phase of the project and vital for the algorithmic model, the nature and meaning of the data elements involved, the output we can expect.
- Data Collection and pre-processing. Identifying coherent input data sets, assessing the maturity of data sources and transforming raw data into human readable format.
- Data Cleaning. Data cleaning can be the most time consuming part of the process which consists in preliminary analysis aimed at extracting noise from the raw data to get clearer signals. Data Cleaning is achieved by exploring the data for coherence, applying visual analysis, plotting data, descriptive statistics. Large datasets contain noise by default: missing values, incorrect values, outliers.
- Data Modelling Important differences apply between supervised and unsupervised models, in general some variables are likely to be redundant, irrelevant or not valuable to the analysis; we thus aim important to getting a short list of input variables. This phase is preliminary to the model and is aimed at (i) determining which existing variables are likely to be predictive and (ii) identifying and creating significant new features for making the model more effective. The new features generation, derived from the transformation of the input data, is the trick of the trade in implementing effective algorithms and machine learning models.
- Statistical Model Evaluation. We use statistical technique for eliminating redundant variables and synthesizing correlated variables into common hidden factors. A predictive model is then implemented using various predictive techniques evaluated separately or together in ensemble models. The statistical evaluation is based on evidence like: misclassification error, sensitivity, specificity, confusion matrix.
- Visualization & Interpretation. Applying interpretation is where higher-order data analysis occurs. What do our signals mean? Is there a clear cause-effect relationship or purely statistical correlation? Visualization is often used as a methodology that can help interpretation.
- Implementation Phase. Once a model has been validated with statistical tests and endorsed by analysts, we move to a continuous prediction phase; prior to its implementation phase, we will monitor the model performance using a control group or parallel “champion-challenger” implementation.
- Intervention phase. Once you’ve acquired your data, pre-processed it, cleaned it, analysed it, visualized it, developed interpretations of it, it is time to decide what actions can be taken based on the outcome of the model